.avif)
If you've ever wondered whether your mileage reimbursement program is aligned with the market, you're not alone.
One of the hardest parts of managing a vehicle reimbursement program is knowing what "normal" looks like.
The IRS's recent mid-year increase to the standard mileage rate, from 72.5 cents to 76 cents per mile effective July 1, 2026, has prompted many organizations to take a closer look at how they're reimbursing employees for business driving and how their programs compare to the broader market.
Are your reimbursement costs in line with similar organizations? Are employees driving more than they were a year ago? And if costs are increasing, what's actually driving that change?
Those are exactly the questions we set out to answer in Cardata's new 2026 Mileage Reimbursement Benchmark Report, which analyzes anonymized reimbursement data from organizations across the U.S.
While every organization is different, the data reveals a few clear trends that every HR, Finance, and Operations leader should know.
Let's unpack some of the report's key takeaways.
1. The Average Mileage Reimbursement is Climbing
For many organizations, reimbursement is one of the largest variable costs associated with supporting a mobile workforce.
Understanding what's driving those increases is the first step toward managing them effectively.
The 2026 Mileage Reimbursement Benchmark Report showed a very clear trend: Companies are paying more to reimburse employees who drive their personal vehicles for work.
According to the benchmark data, the average monthly reimbursement increased from $566 to nearly $639 per driver, a 12.9% year-over-year increase.
At the same time, the average reimbursement cost per business mile rose from $0.57 to $0.60.
Those findings align with broader market trends.
The IRS recently increased the standard mileage rate from 72.5 cents to 76 cents per mile, effective July 1, 2026, reflecting the continued rise in vehicle ownership and operating costs.
These increases are a reflection of the rising cost of driving. Insurance, maintenance, depreciation, and other ownership costs continue to put pressure on reimbursement budgets.
Those same cost pressures also affect company-owned fleets, highlighting the importance of evaluating the full cost of business transportation, regardless of the model an organization uses.
If your reimbursement costs have increased over the last year, you're certainly not the only organization seeing it.
2. Employees Are Driving More Than They Were Last Year
It's not just reimbursement rates that are increasing. The number of business miles employees are driving is increasing, too.
Our 2026 Mileage Reimbursement Benchmark Report found that employees are spending more time on the road.
Average monthly business mileage climbed from 994 miles to 1,061 miles, which works out to roughly 800 additional business miles per driver each year if that trend continues.
That matters because mileage itself is becoming a larger cost driver.
For organizations using Cents-Per-Mile (CPM) reimbursement, every additional mile directly increases reimbursement spend.
Even companies using more customized reimbursement programs should keep an eye on changing driving patterns when reviewing budgets.
3. Where and How You Operate Still Makes a Huge Difference
The benchmark data reinforces an important reality: where your employees drive matters.
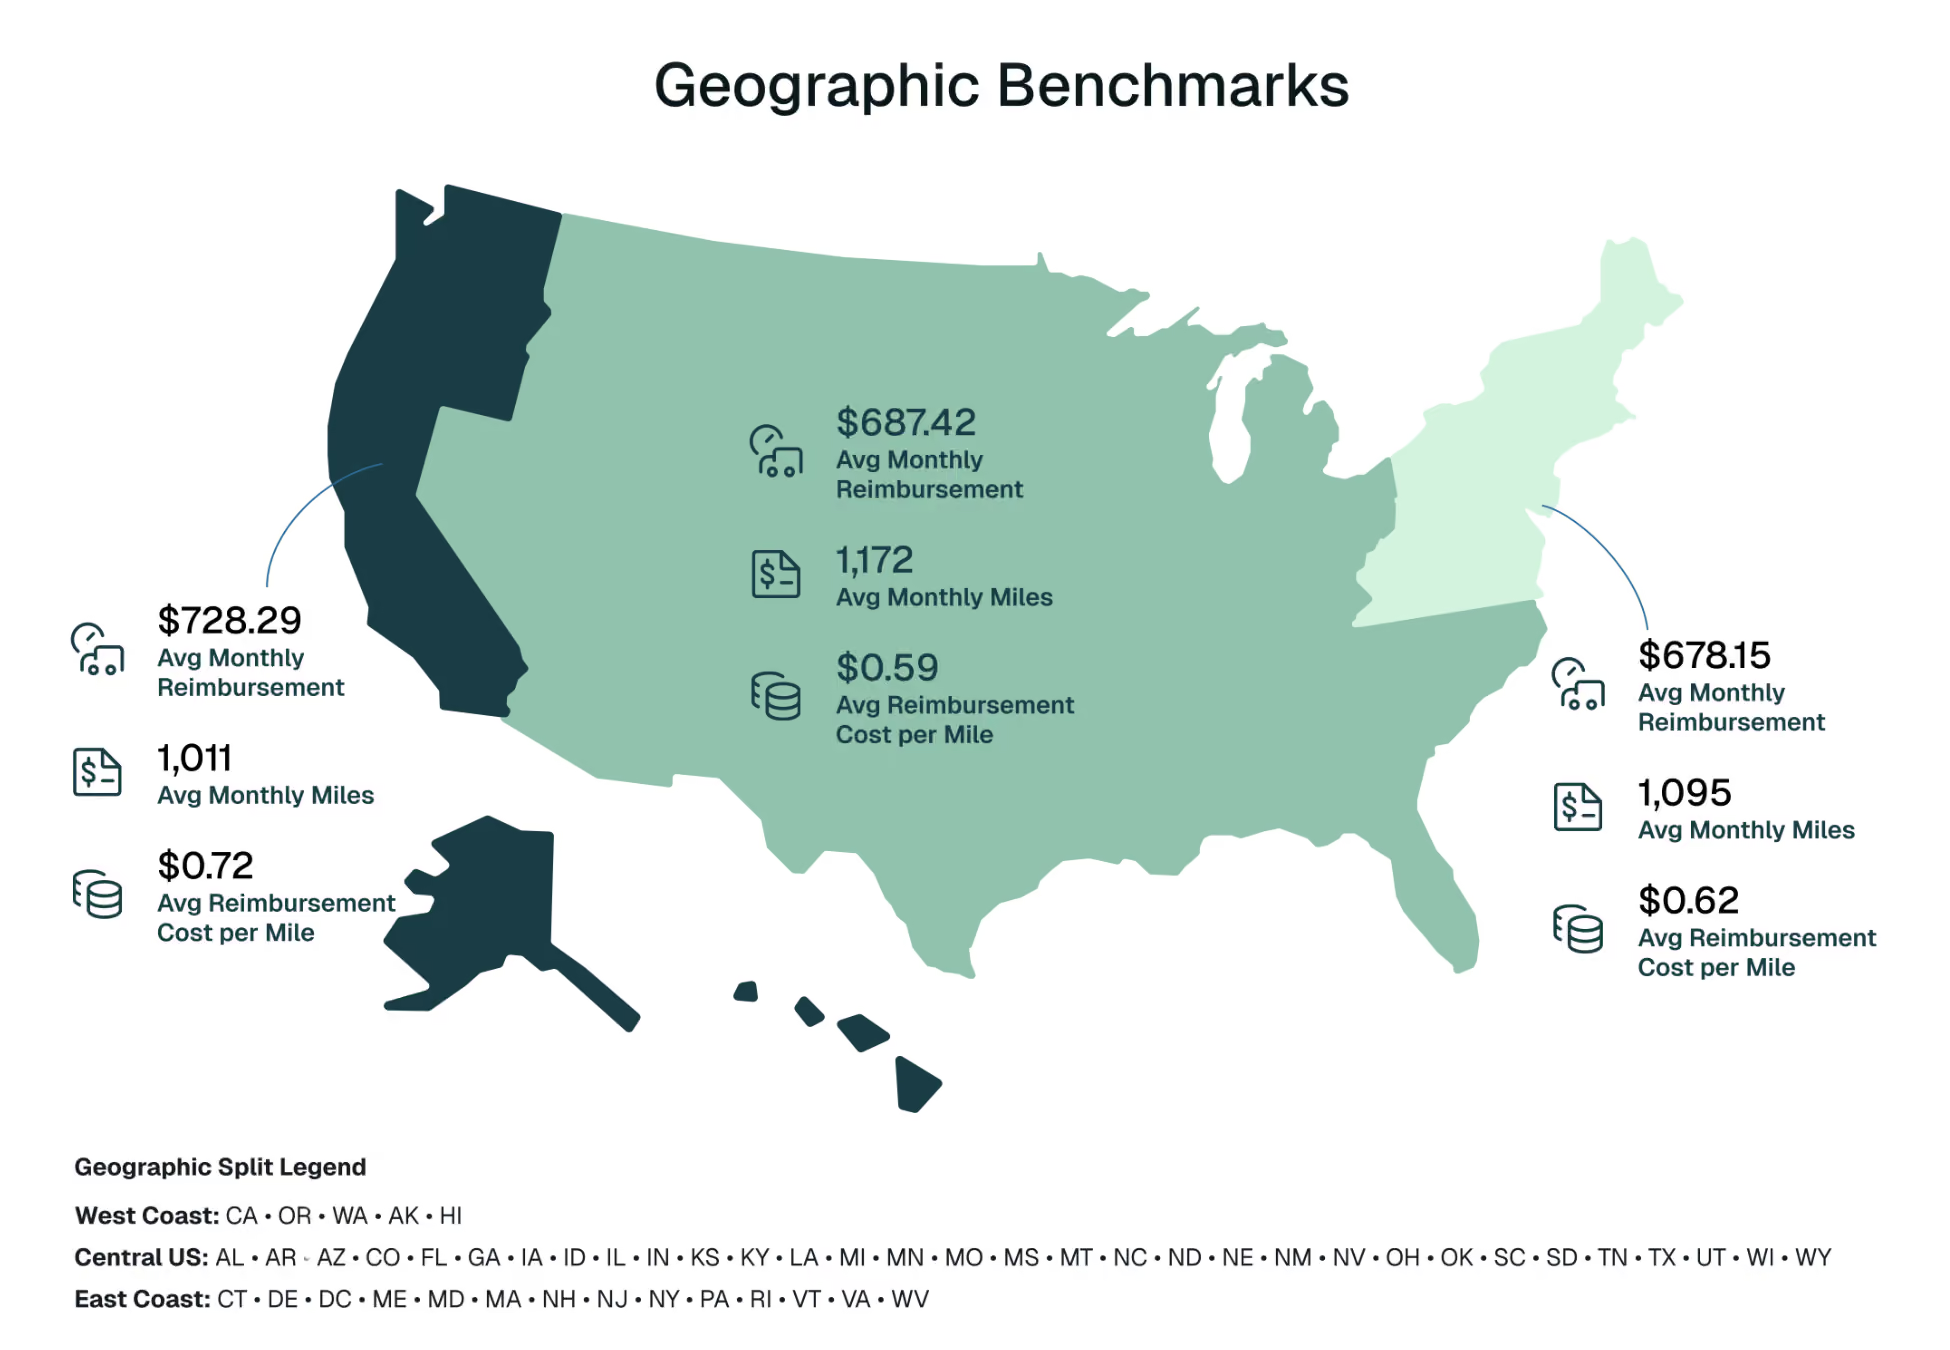
The data found that drivers on the West Coast received the highest reimbursements and the highest cost per mile, despite driving fewer miles than many drivers in the Central U.S.
This is a good reminder that there's no such thing as a universal "right" reimbursement amount.
Vehicle ownership costs vary significantly from one region to another.
Fuel prices, insurance premiums, taxes, registration fees, and maintenance expenses all influence what it actually costs employees to drive for work.
Comparing your reimbursement program to a national average is helpful, but the most meaningful comparisons come from organizations with similar employee roles, driving patterns, and geographic footprints.
Job function is just as important as geography.
For example, our 2026 Benchmarks Report found that Operations employees averaged 1,540 business miles per month, the highest of any role, while Executive Leadership averaged 1,022 miles.
Yet Executive Leadership received the highest average monthly reimbursement at $777.10, compared with $759.61 for Operations.
That difference reflects the fact that reimbursement is influenced by more than mileage alone.
Vehicle costs, program design, and the business needs of different roles all play a part in determining what a fair reimbursement looks like.
In many cases, organizations with employees in multiple regions will often benefit from reimbursement programs that account for local driving costs rather than relying on a single nationwide rate.
4. The Right Reimbursement Method Matters
One of the more interesting findings from the report is how differently reimbursement methods responded to changing driving patterns.
Fixed and Variable Rate (FAVR) programs saw relatively moderate reimbursement growth, driven mostly by increases in the underlying cost of owning and operating a vehicle.
Cents-Per-Mile (CPM) programs, on the other hand, experienced much larger reimbursement increases because employees simply drove more business miles.
Since CPM reimburses every mile driven, higher mileage translates directly into higher reimbursement costs.
The takeaway is that when reimbursement costs increase, the reimbursement method is only part of the story.
Changes in employee driving behavior can have an even bigger impact. Looking at reimbursement totals alone doesn't always tell you what's driving the increase.
So, What Defines "Good" Mileage Reimbursement?
It's one of the most common questions we hear.
The answer is that there isn't a single reimbursement amount that's right for every organization.
A fair and effective reimbursement program depends on several factors, including:
- How much employees drive
- Where they're located
- The type of work they do
- The reimbursement method you're using
- Your organization's goals around cost control, fairness, and compliance
That's why benchmarking is so valuable.
The goal isn't to move every organization toward the same reimbursement level. It's to provide context so you can make informed decisions about whether your program supports your workforce, your budget, and your business goals.
That context helps you determine whether your reimbursement strategy is aligned with your workforce, your budget, and today's market.
Want to See How Your Program Compares?
The findings above are only a small sample of what's included in our full benchmarks report.
Inside, you'll also find benchmarks for:
- Average monthly business mileage
- Reimbursement costs by job function
- Reimbursement trends by region
- Cost per mile by reimbursement method
- Year-over-year program performance
- Comparisons between reimbursement and company-owned fleet costs
Benchmarking isn't about chasing industry averages. It's about understanding whether your reimbursement strategy still reflects the realities of your workforce.
As driving patterns, operating costs, and reimbursement methods continue to evolve, regular benchmarking helps organizations make informed decisions instead of relying on assumptions.
If you're reviewing your mileage reimbursement program this year, these benchmarks provide useful context for understanding where your organization sits relative to the market.