Follow us on LinkedIn
Our PageThe 2025 IRS Standard Mileage Rate: 70¢
Starting January 1, 2025, drivers can claim the following IRS standard mileage rates for various cases:
The IRS standard mileage rate for business travel will be 70 cents per mile, representing a 3-cent increase from 2024’s rate.
For medical transportation and qualified active-duty military moves, the rate remains steady at 21 cents per mile.
Charitable organization driving continues at 14 cents per mile, unchanged from the previous year.
These rates are applicable for cars, vans, pickups and panel trucks; including electric, hybrid, gasoline, and diesel vehicles.
For companies using FAVR programs, the maximum standard vehicle profile cost is now $61,200.
Forecasting the 2025 IRS Standard Mileage Rate
The IRS standard mileage rate is a crucial benchmark for business travel deductions and reimbursements. It is the tax-test rate for Cents per Mile and Tax-Free Car Allowance vehicle reimbursement programs. As we approach 2025, current trends and historical patterns provide insight into a potential rate adjustment.
Current rate structure (2024)
The present rate of 67¢ per mile reflects two main components:
- Depreciation: 30¢ (45% of total)
- Operating costs: 37¢ (55% of total)—insurance, maintenance, and fuel costs
Key market indicators
Insurance costs
Insurance expenses show an exceptionally strong correlation (87.6%) with rate adjustments. The 16.3% year-over-year increase through October 2024 represents the most dramatic rise in a decade. This unprecedented acceleration in insurance costs could significantly influence the 2025 rate decision.
Maintenance trends
Maintenance costs have demonstrated the strongest statistical correlation (92.6%) with rate adjustments since 2014. The steady 1.86% year-over-year increase through October 2024 continues a consistent upward trajectory observed since 2021, suggesting sustained pressure on operating costs.
Fuel price impact
While fuel prices show a moderate correlation (60.7%) with rate changes, current prices of $3.26/gallon sit comfortably within the historical range of $2.20-3.70. This relative stability indicates that fuel costs may play a less significant role in the 2025 adjustment compared to other factors.
Historical context
| Depreciation Component Analysis | |||
| Year | Depreciation | Total Rate | % of Rate |
| 2024 | 30¢ | 67¢ | 45% |
| 2023 | 28¢ | 65.5¢ | 43% |
| 2022 | 26¢ | 62.5¢ | 42% |
| 2021 | 26¢ | 56¢ | 46% |
| 2020 | 27¢ | 57.5¢ | 47% |
Recent rate adjustments
The IRS has shown consistent responsiveness to market conditions:
- January 2024: +1.5¢ (65.5¢ → 67¢)
- January 2023: +3¢ (62.5¢ → 65.5¢)
- July 2022: +4¢ (58.5¢ → 62.5¢)
2025 rate forecast: 68-70¢ per mile
We forecast that the 2025 IRS mileage rate will be between 68¢ and 70¢ per mile.
Component projections
1. Depreciation: 31-32¢
- Follows established pattern of 1-2¢ annual increases
- Supported by sustained elevated vehicle prices
2. Operating costs: 38-39¢
- Driven by accelerating insurance costs
- Influenced by steady maintenance cost increases
- Stabilized fuel price environment
Supporting factors
- Unprecedented acceleration in insurance costs
- Consistent upward trajectory in maintenance expenses
- Strong statistical correlation with primary predictors
- Conservative component estimates supporting 68¢ baseline
Risk considerations
- Potential IRS view of insurance spike as temporary
- Fuel price volatility risk
- Uncertainty around vehicle price stabilization
Methodology and sources
Analysis incorporates monthly data from 2014-2024, utilizing:
- Bureau of Labor Statistics CPI data
- EIA national fuel price averages
- Industry vehicle pricing reports
- IRS historical rate documentation
NB: this forecast applies rigorous statistical analysis to historical trends while accounting for current market dynamics. However, the final rate determination remains at the discretion of the IRS.
Sources
- Weighting data: https://www.irs.gov/pub/irs-drop/n-24-08.pdf
- Car prices: https://www.kbb.com/car-advice/when-will-car-prices-drop/
- Insurance: https://data.bls.gov/timeseries/CUUR0000SETE?output_view=data
- Maintenance: Consumer Price Index for All Urban Consumers: Motor Vehicle Parts and Equipment in U.S. City Average (CUUR0000SETC) | FRED
- Gas: Gasoline and Diesel Fuel Update – U.S. Energy Information Administration (EIA)
- Supporting:
The 2024 IRS Standard Rate
Update, December 14th 2023: the IRS has announced their new 2024 mileage rates.
- Business use is 67¢ per mile, up from 65.5¢ in 2023.
- Medical or moving purposes: 21 cents per mile.
- Service of charitable organizations: unchanged at 14 cents per mile.
The maximum standard vehicle cost allowance for FAVR and fleet programs has also been announced.
- The maximum standard vehicle cost is The maximum standard automobile cost for 2024 is $62,000. This is up from $60,800 in 2023.
See our full article and announcement of the 2024 IRS rate:
IRS Announces 2024 Mileage Rates (67¢) | Cardata
Introduction
The IRS mileage rate lets employees drive personal vehicles for work and get tax deductions or reimbursements. Employees can keep track of their expenses and deduct the IRS mileage rate times their mileage at tax time. Employers can also base cents per mile programs on the IRS rate, or anything up to the rate: the rate is an optional maximum for mileage reimbursements.
Using the Internal Revenue Service’s standard mileage rate to reimburse employees for work-related driving has much to recommend it. It is vastly better than unjustified and taxable systems like flat rate car allowances (no recordkeeping). And while it may not always be the most efficient method for tax waste, it requires low administrative labor and is easy to document.
Given these factors, it’s understandable that many HR and fleet managers use the IRS cents per mile rate for car allowance programs. The IRS offers this program because it’s less complicated for their tax agents and business owners and provides tax savings that re-enter the U.S. economy.
But when using the IRS standard mileage rate, you should know a few things. Chief among them is that the cents per mile rate isn’t a fixed, permanent entity – it changes from year to year, just as interest rates can change – and in fact, the IRS can change its cents per mile rate twice per year if need be.
In today’s fraught economic climate, your organization must remain agile and responsive to changes. When the IRS chooses to modify the standard mileage rate, your business may suddenly be paying more for car allowances if the rate is moved upwards. We can look to the recent past for guidance to navigate a course to the future through choppy waters. The economy moves in cycles, and the IRS standard mileage rate rises and falls in response to these cycles.
While investment counsel always stresses that past performance cannot guarantee future returns, in economics, we must study the patterns and conditions of the past to understand the present – and where things may develop from this vantage point.
Global interest rates have risen higher than ever in the last four years in response to record-high inflation driving up prices in the wake of COVID-19. Similarly, those high inflation rates were due to the outbreak of war on the European continent and disruptions to supply chains and global labor markets due to COVID-19. Further conflict in the Middle East threatens to prolong global instability and energy insecurity.
In short, there are no effects without causes. Studying economic reasons and their results can allow you to predict likely outcomes and prepare accordingly. While it can feel as though the world is on the brink of catastrophe, this isn’t the first time conflict and strife have defined the global economic picture. In those periods, prudent oversight of expenditures becomes even more critical.
We will take a big-picture look at the history of IRS standard mileage rate changes, whether those changes align with economic downturns, and what information we can use to set a course toward profitability through the next boom-bust cycle.
Table & Chart: the Federal Mileage Rate 1994 – 2023
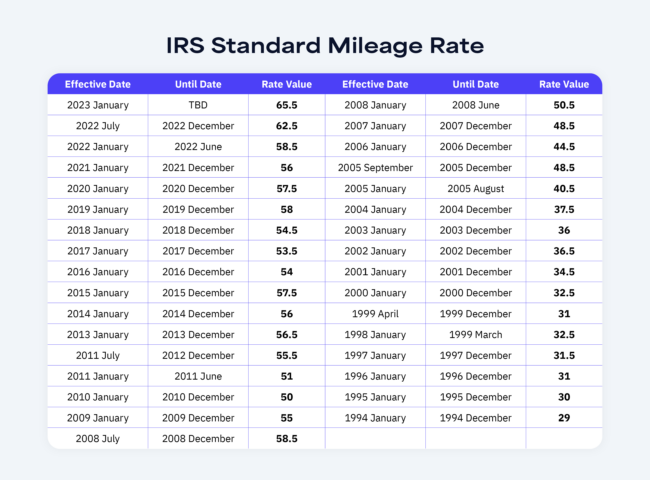
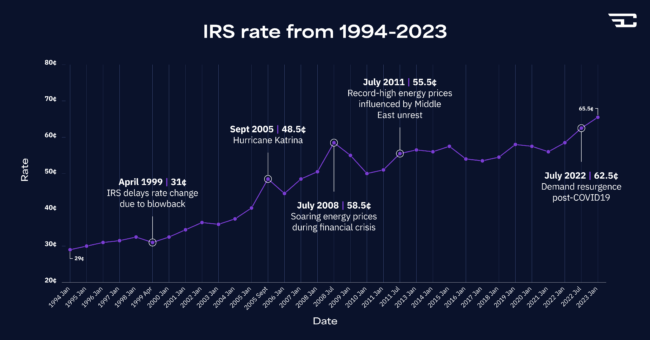
Look at the following infographic showing the rate changes from 1994 onward. We’ll explain each section in detail below.

This table shows the IRS Standard Mileage Rate from 1994 to 2023, including midyear changes in 2005, 2008, 2011, and 2022.
And below you can see the trendline of the IRS rate for the same dates:

Understanding The Federal Mileage Rate
The IRS standard mileage rate offers businesses a simple way to compensate employees for work-related driving, lowering overhead costs for firms compared to company car fleets. It also reassures employees of fair reimbursement for using their personally owned vehicles while reducing the amount of administrative labor they must perform to claim the benefit.
It is a lightweight form of economic stimulus when compared to heavier-handed measures such as quantitative easing, as the tax savings go directly to businesses, their drivers, and secondarily to the Federal government, which takes in less revenue by the cents per mile method but saves indirectly by reducing the cost of staffing for the Internal Revenue Service.
Imagine how many IRS agents would be required to verify claims for actual expenses and collate receipts for on-the-road purchases for every business in America. A simplified formula makes sense, given the outsized demand.
How The IRS Mileage Rate Changes To Reflect Economic Conditions
The economy of the United States is enormously complex, composed of tens of thousands of businesses employing hundreds of millions of workers.
The IRS must release much information about its internal workings and which department is responsible for adjustments to the Cents Per Mile rate. Some businesses take credit for providing the data on which the IRS bases its decisions, but the process is ultimately a matter of accounting for interrelated macroeconomic trends. [1]
We don’t know which factors go into a decision to update the standard mileage rate each year or what tips the scale in favor of a rate change. But looking at the historical picture, the standard mileage rate increases when the economy is in a downturn, which can provide employees a subtle break in hard times. A slightly larger tax return can mean the difference between solvency and bankruptcy, which keeps the economy growing and makes all the difference.
And yet, when it comes down to brass tacks, the IRS standard mileage rate mostly comes down to a few factors, such as the price of oil and gas. The source cited above claims that in 2022, for example, the rate was increased due to “[s]ignificantly higher fuel prices, which rose 49% for regular gasoline and 55% for diesel fuel over the six months ending June 30, 2022,” as well as the general increase in prices for both new and used vehicles from the 2019 benchmark price. 1
Let’s examine the recent history of IRS mileage rate changes from the 1990s to now and see what the data bears out.
The 1990s: A Decade Of Stability
The 1990s weren’t a stable decade – it only looks that way in hindsight. After all, this is a decade ushered in by a recession, the fall of the Berlin Wall, the first Gulf War, and the collapse of the Soviet Union. Not to mention the widespread adoption of a little thing called the Internet – and look how that turned out.

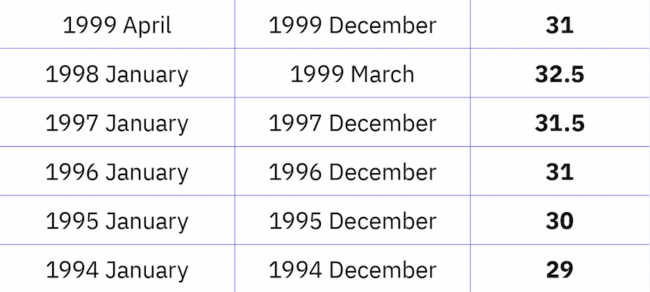
Snapshot from table above: 1990s rates, existing data.
But if you look at the IRS standard mileage rate, you’d barely notice all of this global upheaval. The rate moved from a low of 29 cents in December 1994 to 32.5 cents in 2000. Considering the standard mileage rate jumped up eight-and-a-half cents from 2020 to today, a rise of three cents over a whole decade seems absurd.
Why were the 1990s stable from an IRS rate perspective? Why didn’t the rate change during the late 1990s, despite the beginnings of the dot-com boom and bust and the Yugoslavian war? These are conditions that caused rate changes to happen in other decades, yet the needle doesn’t move strongly in either direction in the entire decade of the 1990s.
This table begins in 1994 after the U.S. economy fully recovered from the 1990-1991 global recession[2]. However, if we look at an alternate source[3], we see that the IRS automobile rate didn’t increase in the late 1980s or early 1990s either, despite a global economic downturn.
The simple answer to the questions above is that the IRS standard mileage rate didn’t change much because oil prices were remarkably stable over the 1980s and 1990s.[4] After the world energy crisis of the late 1970s, restrictions on the price of oil were eased, leading to an oversupply of products that lasted until the early 2000s.
IRS Rate Change Exceptions In The 1990s
History scholars will remember an “oil shock” in 1990 due to Saddam Hussein’s invasion of Kuwait. The price of a barrel of oil doubled from July to October of 1990, which is said to be responsible for the recession of the early 1990s[5].
However, the U.S.-led military intervention quickly fended off the Iraqi forces, and the Gulf War ended six months after it began[6]. The IRS standard mileage rate remained the same in 1990 because the conflict started in August and finished in February. The IRS typically makes rate changes in December and June, although rates have also been changed in the spring and fall.
The collapse of the Soviet Union and the rapid privatization of Eastern Europe and Russia led to a market boom. Indeed, the economy of the U.S. and its allies continued their economic rally over the 1990s, and this positive outlook among policymakers and everyday business owners and workers is likely to be responsible for the lack of rate changes during the decade.
The 2000s: A Transitional Period
The economic decade of the 2000s begins with a bang – with the euphoric investment environment of the 1990s ballooning into what is now known as the “dot-com bubble.” [8]
Dot-Com Boom And Bust
You may recall from other articles that the IRS standard mileage rate tends to increase during difficult economic times and remain stable or even fall during economic booms.
After the 1990s, when the IRS automobile rate only rose two-and-a-half cents, the standard mileage rate increased from 32.5 cents per mile in January 2000 to 36.5 cents in December 2002.
This is in response to the bursting of the dot-com bubble. Consumers began to adopt the Internet, and the investment possibilities this offered seemed endless – at the time. We all know how that turned out: the NASDAQ stock index rose 500% from 1995 to 2000, then lost 75% of its value between March 2000 and October 2002. [9]
Many of these companies received large amounts of capital for investment but needed a path to profitability, simply trading on the possibility of investor returns. This was a setup for a disastrous collapse.
Indeed, as unemployment in the U.S. rose and consumer goods fell out of reach for many who gambled their savings on the promise of easy tech money,[10] the IRS standard mileage rate rose five cents from the first quarter of 2000 to the last quarter of 2002.
Mid-Year 2005 IRS Rate Change
After decades of relative stability, the IRS rate suddenly changed in 2005. The IRS made an exception to their usual December-June announcement schedule, raising the standard mileage rate by a whopping eight points(!) in September 2005.
What caused this dramatic shift? The answer comes down to a single name: Katrina.
Hurricane Katrina formed on August 23, 2005, and dissipated by August 31. The hurricane caused billions of dollars in damage through several states and claimed 1,800 lives. The problem for the rate was that Katrina directly hit the Gulf of Mexico, where most of the U.S. energy infrastructure is located.
By September 1st, the New York Times reported on surging gasoline prices, stating that gas station lineups were higher than ever since the 1970s. [10] The IRS realized how the oil supply crisis would negatively affect businesses and consumers and moved to increase the rate that drivers could claim tax-free by September 9, 2005. [11]
After years of stability, a single storm disrupted the entire U.S. economy in under twenty days. This lends more credence to our hypothesis that gasoline and oil prices are the most crucial factors determining IRS automobile allowance rates.
The IRS dropped the standard mileage rate for 2006 back down to 44.5 points, showing that the oil supply crisis caused by Hurricane Katrina was temporary.
However, the good times were never meant to last.
Read more: IRS Rate 2005: Unprecedented Mid-Year Shift | Cardata
The Great Recession – IRS Rate Changes In 2008
By now, everyone knows the causes and effects of the 2008 recession, often called “The Great Recession” due to its severity, comparable only to the Great Depression of 1933.
The initial economic damage was caused by an overvaluation of U.S. prices, buoyed by so-called “subprime mortgages” given to home buyers who wouldn’t have met eligibility in previous years.
Banks and financial speculators then purchased packages of these mortgages en masse and traded them like bonds, despite the fact they were more risky than either equities or bonds.
The trading frenzy caused banks to give out even riskier mortgages because they could recoup their investment by trading these debt packages. We all know how that turned out.
As banks and mortgage lenders ran out of money, the IRS changed the standard mileage rate by eight points in July 2008.
While the recession only “officially” lasted eighteen months in the United States, it damaged the entire global economy, and economic recovery did not occur until the mid-2010s. Similarly, we see the IRS standard mileage rate rise to a peak in Q3 2008 and gradually lower as the economic crisis unwinds and unfolds.
Read more: Why Did The IRS Mileage Rate Rise In 2008? | Cardata
The 2010s: Recovery And Relative Stability
By midway through the first Obama presidency, the U.S. economy had recovered from the worst of the 2008 meltdown. In hindsight, the 2010s can be considered an uninterrupted bull market if you ignore two outlier periods in 2011 and 2018.
The IRS standard mileage rate stays within ten cents of 50 the entire decade, sometimes rising a point or two in response to a short-term oil price dip or hike, sometimes falling as many as four cents per mile in one announcement.
We didn’t know how good we had it until it was gone. The relative stability of the IRS mileage rate and relative recovery of the economy continue until late December 2019.
Outlier: The 2011 IRS Rate Change
The most dramatic IRS rate change during the 2010s happened in 2011 when the IRS raised the cents per mile reimbursement rate to 55.5 cents from 51.
The culprit? You guessed it: oil prices. The 2011 oil price spike was due to the war in Libya and events surrounding the Arab Spring. The slight disruption to oil supplies rocketed through the entire economy, causing the IRS to raise the rate dramatically in July 2011.
Read more: IRS Mileage Rate Midyear 2011 & Economic Conditions | Cardata
Covid-Era And The IRS Standard Rate: 2020 To Present Day (Updated Fall 2023)
The impact of COVID-19 shocked the world, although dramatic financial measures by Western central banks and a bottoming-out of global interest rates injected life into the economy when it was needed most.
That’s cold comfort today to most, as inflation has driven up prices at the pump and the grocery store, as both rely on cheap fuel. U.S. households get hit while down as the Fed raises mortgage and debt interest rates to try to cool down the overheating economy. [12]
COVID-19 damaged global supply chains and caused a worldwide labor shortage. The Russo-Ukrainian War that began in 2022 poured gasoline on the fire, causing the price of everything from used cars to Brussels sprouts to rise.
Unsurprisingly, the IRS must set a new benchmark mileage rate of 65.5 cents per mile in January 2023. After all, the cost of driving keeps climbing higher. If these trends continue, we can expect further rate rises.
However, there are some excellent reasons to be optimistic about the IRS rate for 2024 and beyond. Here’s what we think could happen.
Read more: The IRS Mid-Year Rate Shift Of 2022 | Cardata
How To Prepare For Future IRS Standard Rate Hikes
Sound business sense doesn’t change with the times but is based on a few fundamentals. Buy low, sell high, keep profits healthy, and save for bad times during good.
If the global economy slows down and keeps prices in check, central banks may lower interest rates again, freeing up capital for investment.
One way your business can protect itself against IRS standard mileage rate changes is to limit your exposure to the rate. This can be accomplished by tracking actual expenses – which has downsides – or by switching to FAVR, a newer compensation model also sanctioned by the IRS.
While FAVR programs still have some variable cents-per-mile payment components, they also incorporate a fixed rate that accounts for the depreciation of vehicles and other expenses not covered by a variable-only Cents per Mile rate.
Conclusion
The IRS rate has a long and complex history, and is intimately tied to the economy and energy prices. Understanding the IRS rate can help your business prepare for economic success now and in the future. If you have any questions, we’re happy to discuss them with you. Just reach out to Cardata.
Sources
[1] IRS issues standard mileage rates for 2023 | Internal Revenue Service
[2] Early 1990s recession in the United States | Wikipedia
[3] Historical IRS Mileage Rates | Trego’s Mountain Ear
[4] Crude Oil Prices | MacroTrends
[5] “Discretion Versus Policy Rules In Practice” | John B. Taylor, Stanford University
[6] Persian Gulf War | Britannica
[7] Dotcom Bubble Definition | Investopedia
[8] Stock Market Prices, Real-time Quotes & Business News | Google Finance
[9] Business Cycle Dating | NBER
[10] Gas Prices Surge as Supply Drops | The New York Times
[11] News Release IR-2005-99 | Internal Revenue Service[12] 2021–2023 Inflation Surge | Wikipedia
Disclaimer: Nothing in this blog post is legal, accounting, or insurance advice. Consult your lawyer, accountant, or insurance agent, and do not rely on the information contained herein for any business or personal financial or legal decision-making. While we strive to be as reliable as possible, we are neither lawyers, accountants, or agents. For several citations of IRS publications on which we base our blog content ideas, please always consult this article: https://www.cardata.co/blog/irs-rules-for-mileage-reimbursements. For Cardata’s terms of service, go here: https://www.cardata.co/terms.
Share on:


